FIRST FREE LIVE SESSION Gold · Sunday, October 11 · 7 PM CentralView event

THE FREE COLLECTION / MONTINAC

A clearer chart.
A free place to start.

Five focused TradingView indicators for the way you read a chart. Find the tool that adds something useful to your process.

Free scripts. No Montinac subscription or email signup.

PICK A TOOL. MAKE IT YOURS.

Built to earn a place
on your chart.

Keep the tools you need.
Leave room for price.

5 free indicators

01 / Value & trendFREE
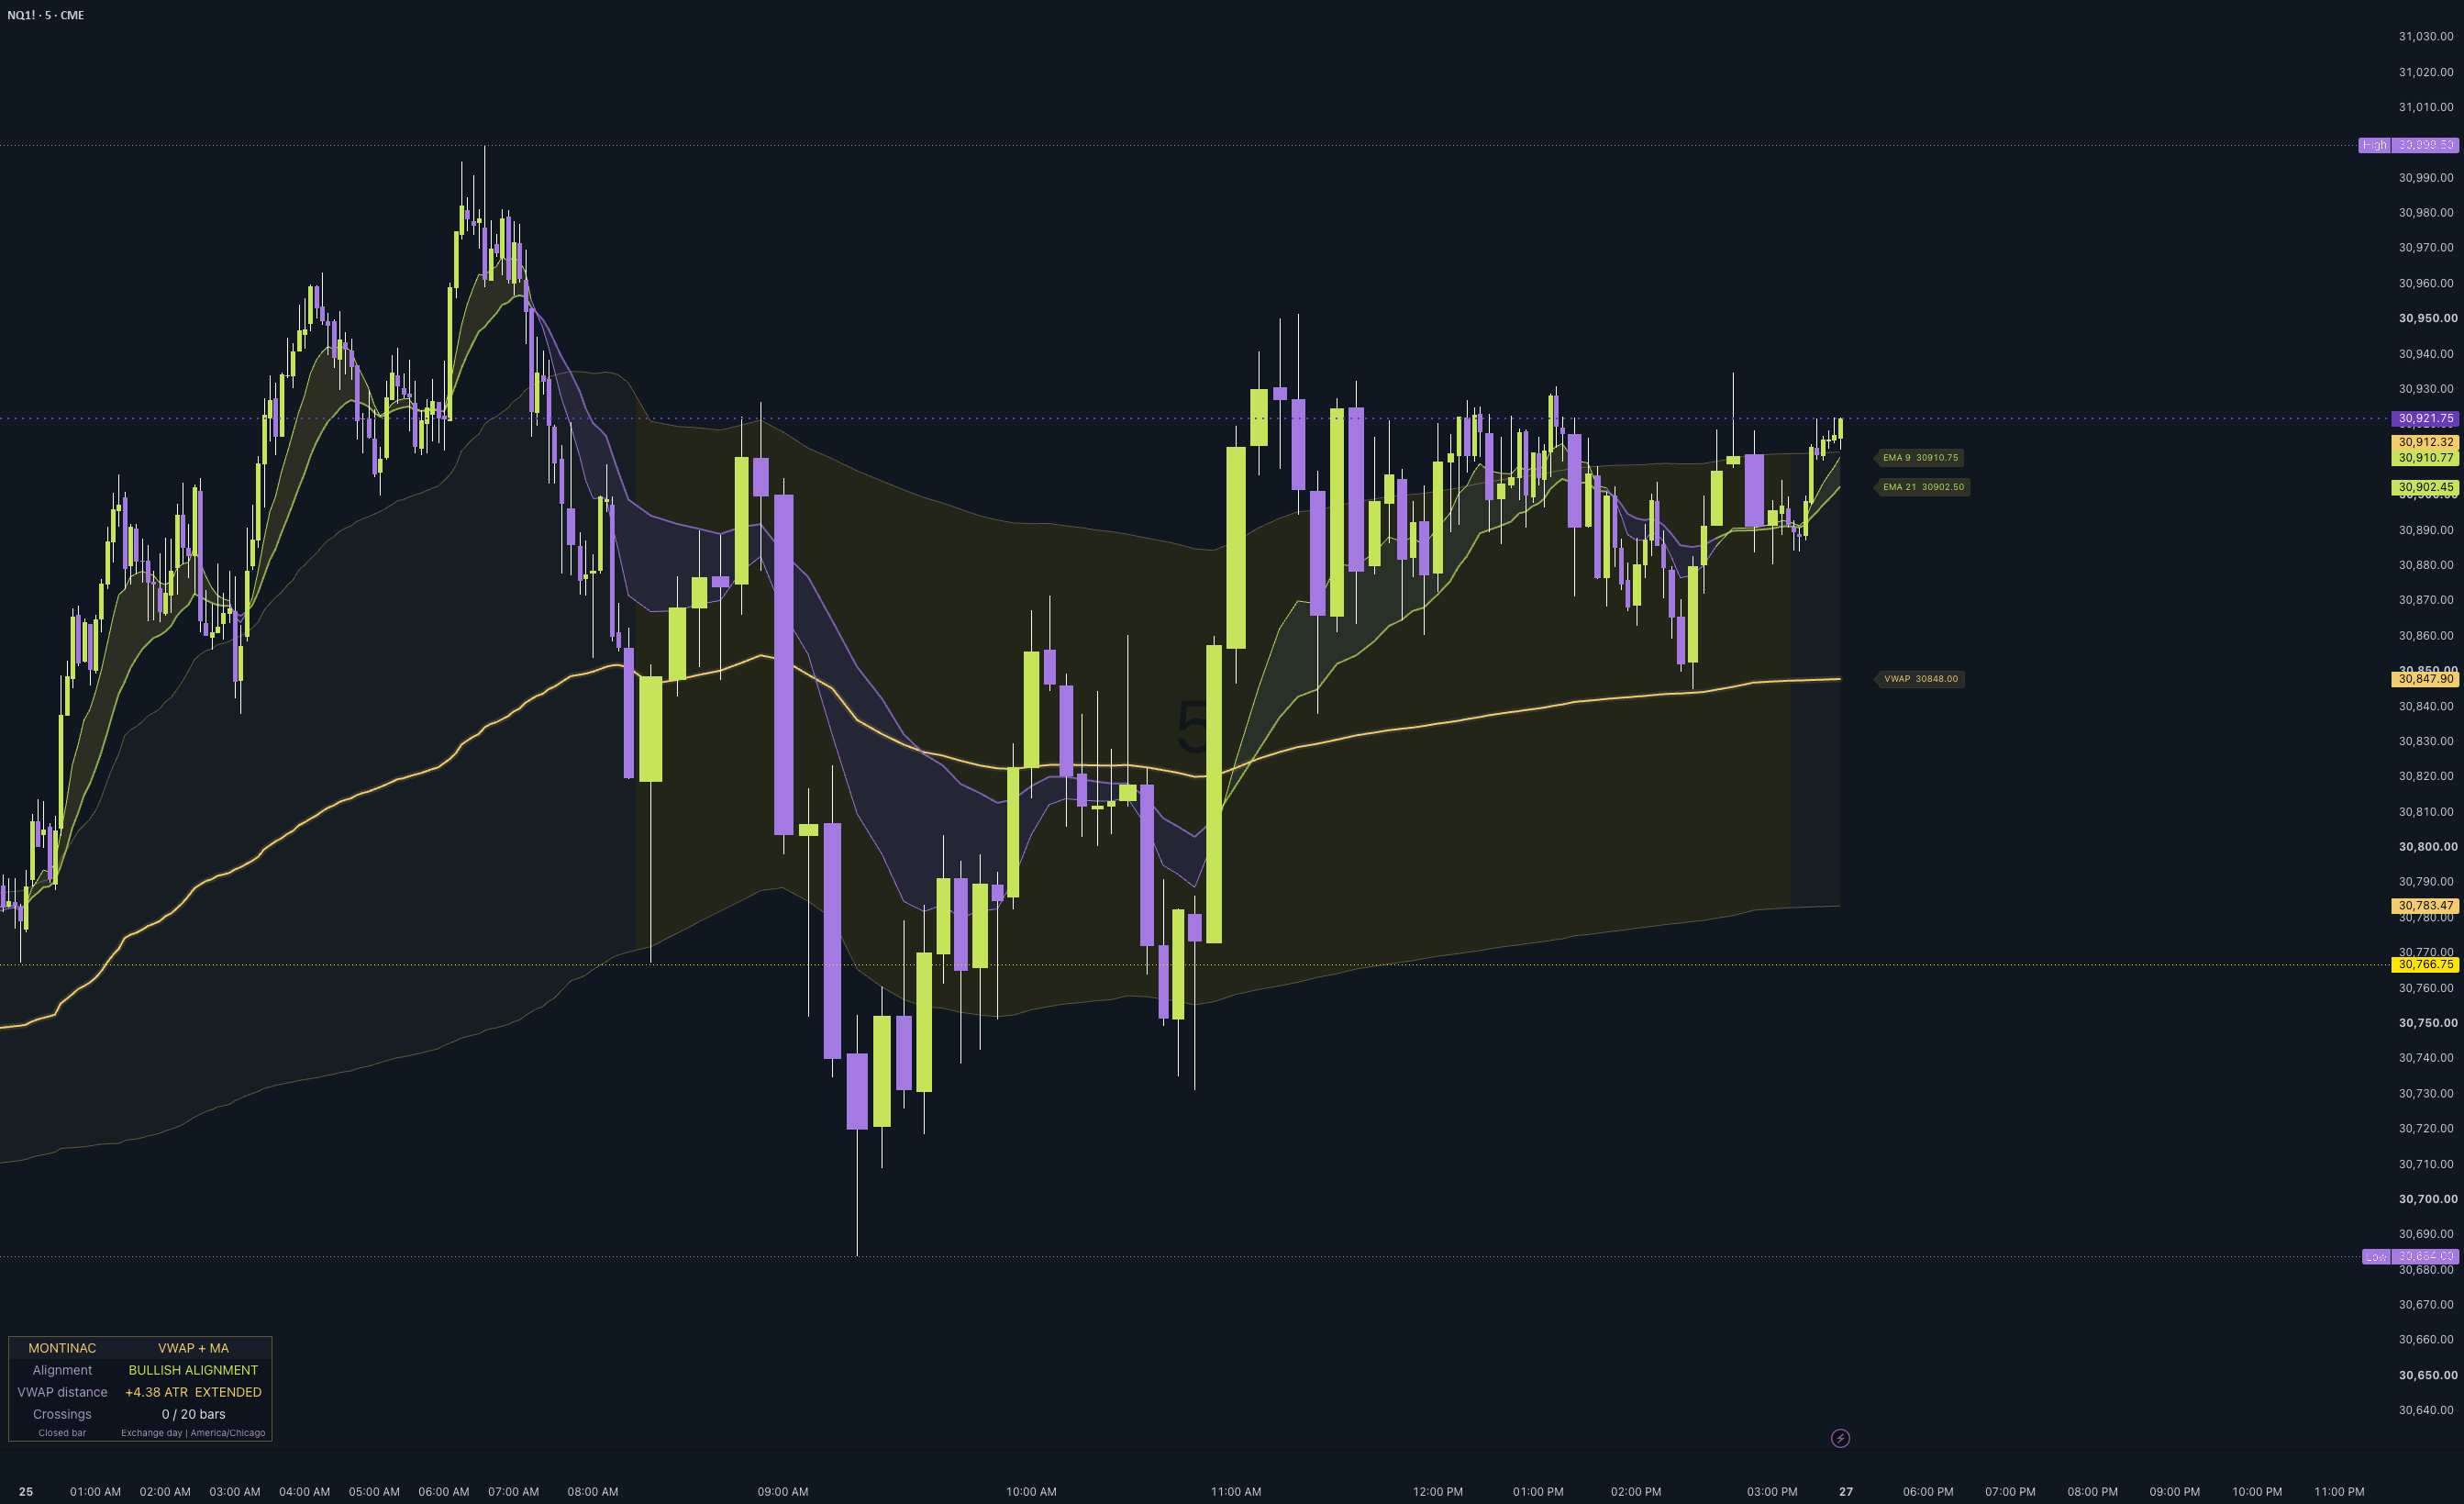
Published Montinac VWAP and Moving Averages chartView chart

VWAP + Moving Averages

Put price in perspective.

Session VWAP and flexible moving averages, with a compact read on alignment, extension and repeated VWAP crossings.

  • Exchange, US cash, CME or custom sessions
  • Five moving-average types + optional deviation bands
  • ATR-normalized distance and confirmed-close alerts
What to know

A session reference for price. An extended reading does not predict a reversal.
02 / Value & trendFREE
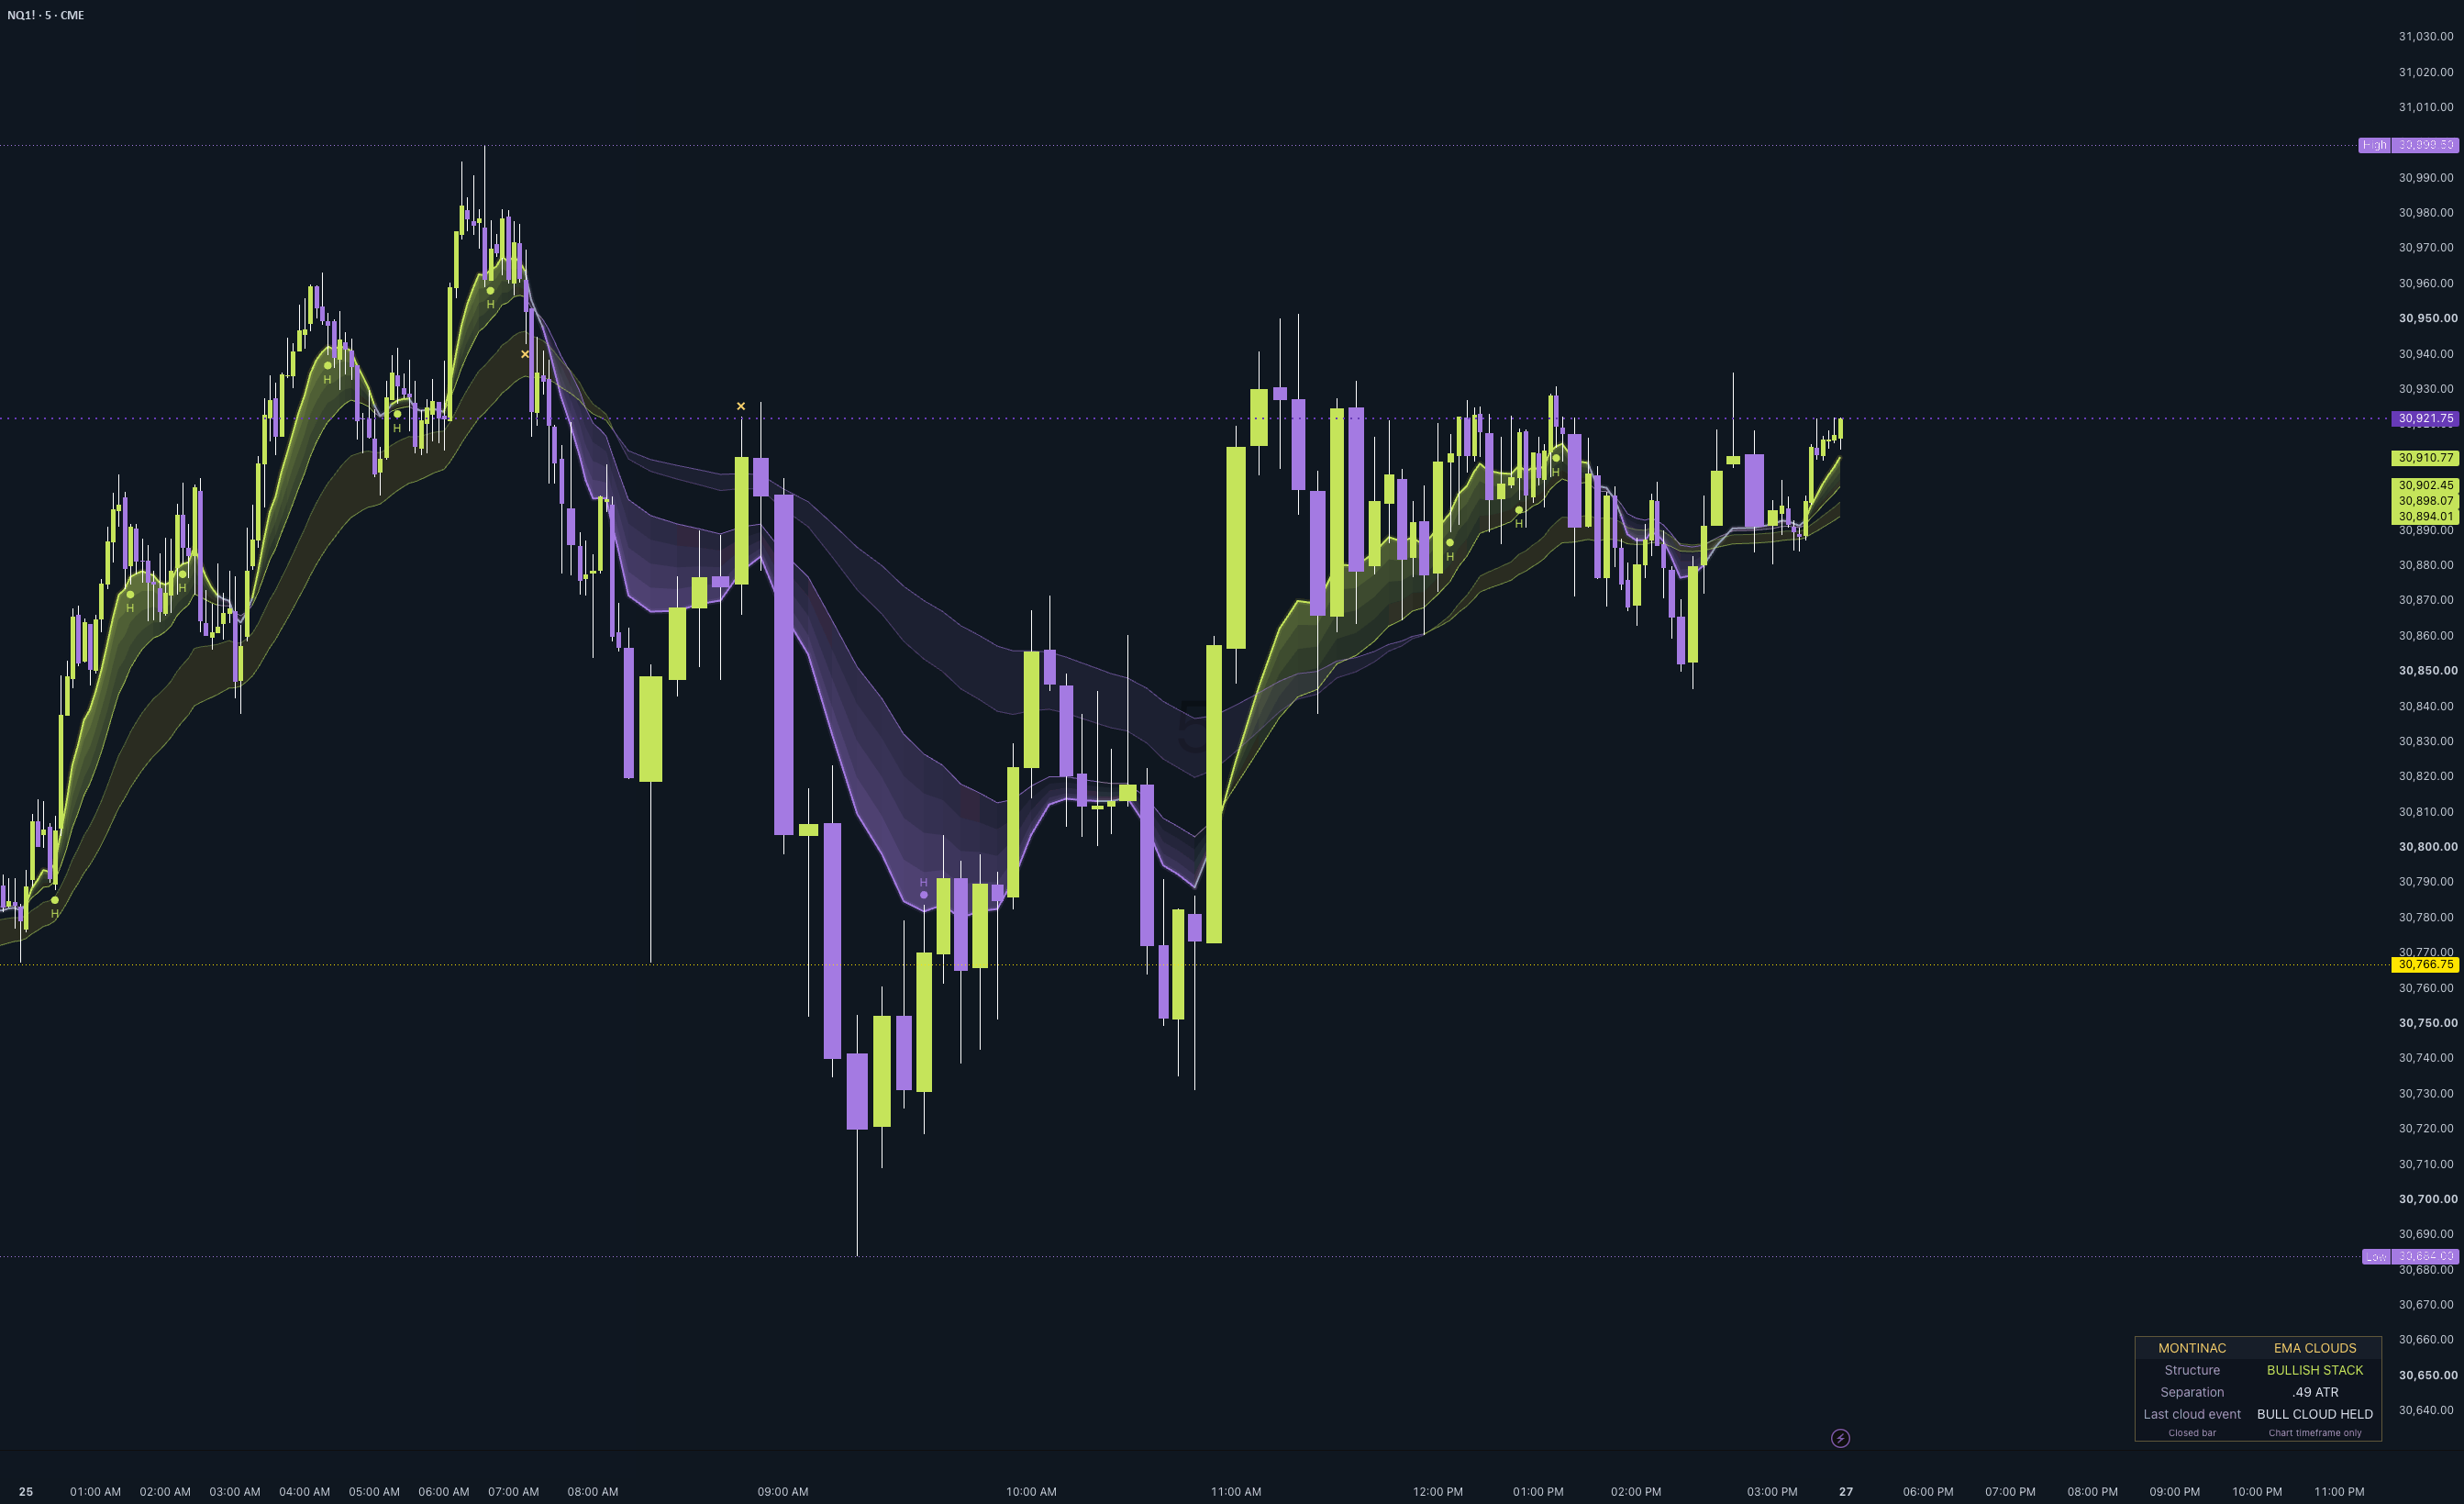
Published Montinac EMA Clouds chart with lime and amethyst ribbonsView chart

EMA Clouds

See the shape of a trend.

Layered EMA clouds make alignment, compression and pullback reactions easier to follow without filling the chart with text.

  • Fast 9/21 and base 34/50 clouds
  • Volatility-adjusted compression display
  • Cloud-hold and cloud-loss markers
What to know

Reaction markers describe the cloud relationship; they are not general reversal signals.

03 / Levels & sessionsFREE
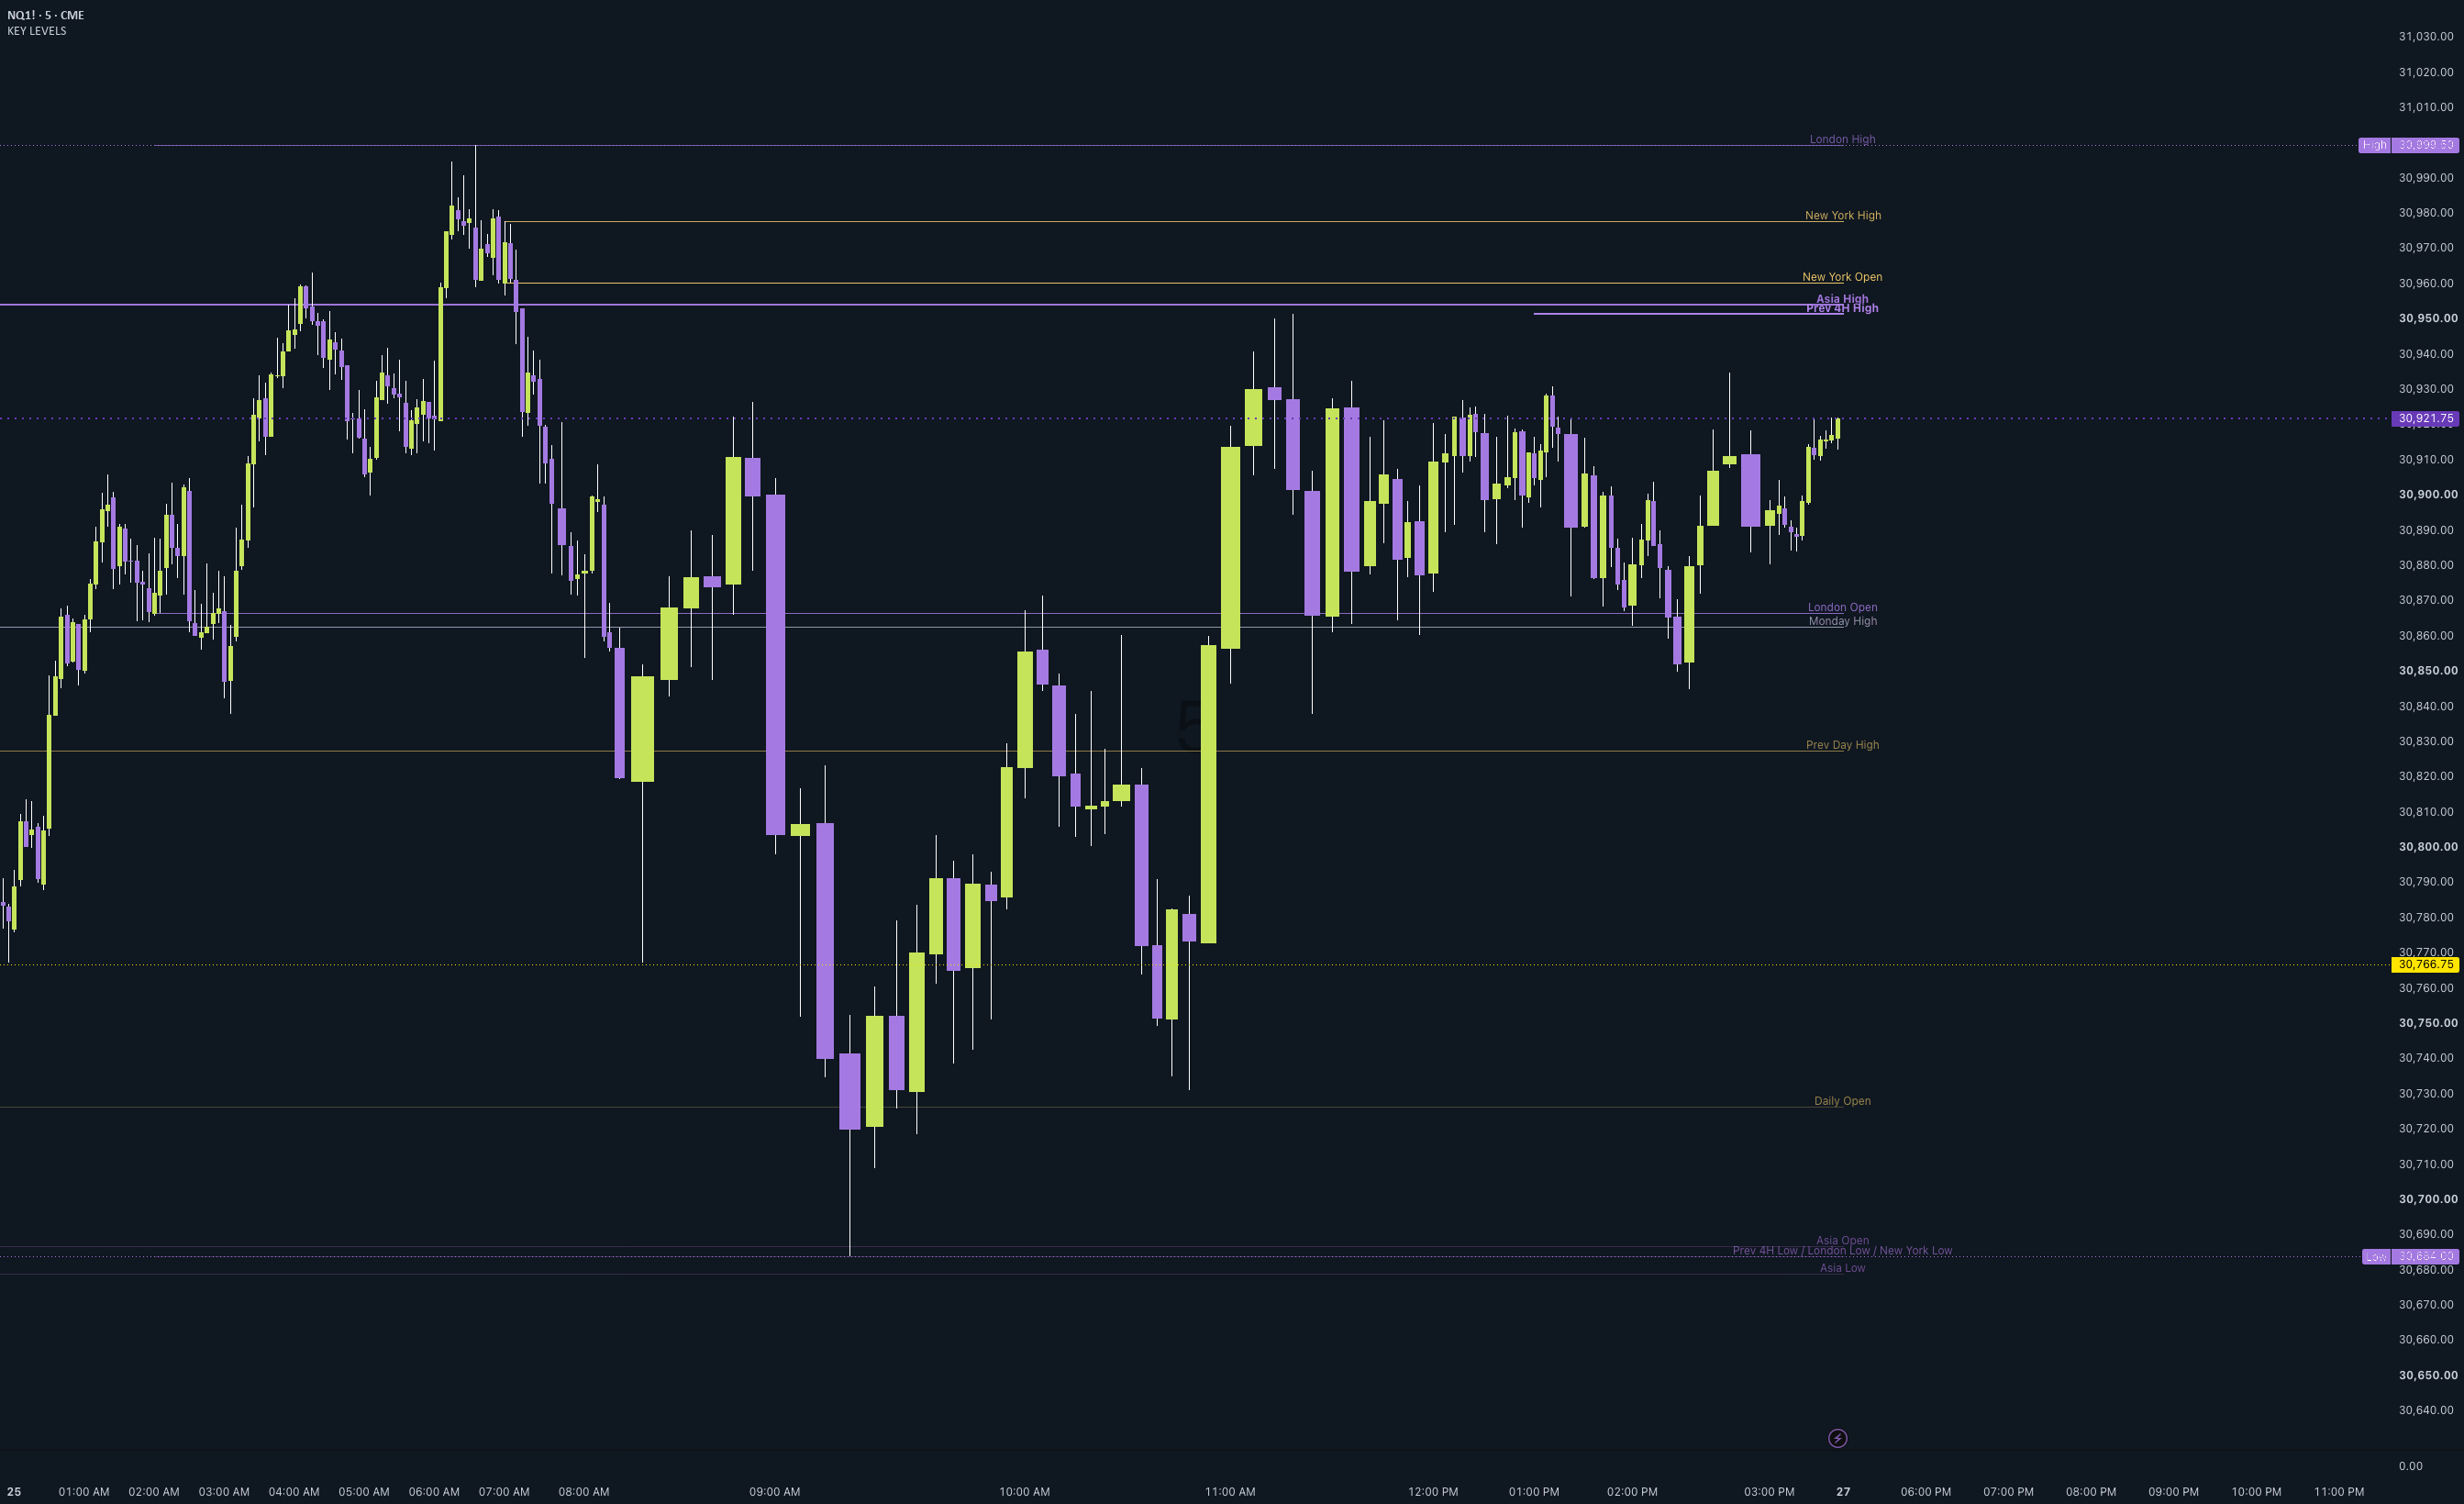
Published Montinac Key Levels chart with labeled horizontal referencesView chart

Key Levels

Keep your references in view.

Period opens, previous highs and lows, and session ranges in one clean overlay. Nearby levels stand out as price approaches.

  • Daily, weekly, monthly and other period references
  • London, New York and Tokyo session ranges
  • Right-anchored labels and proximity emphasis
What to know

Each session has its own hours and timezone. Developing ranges can change while forming.

04 / Levels & sessionsFREE
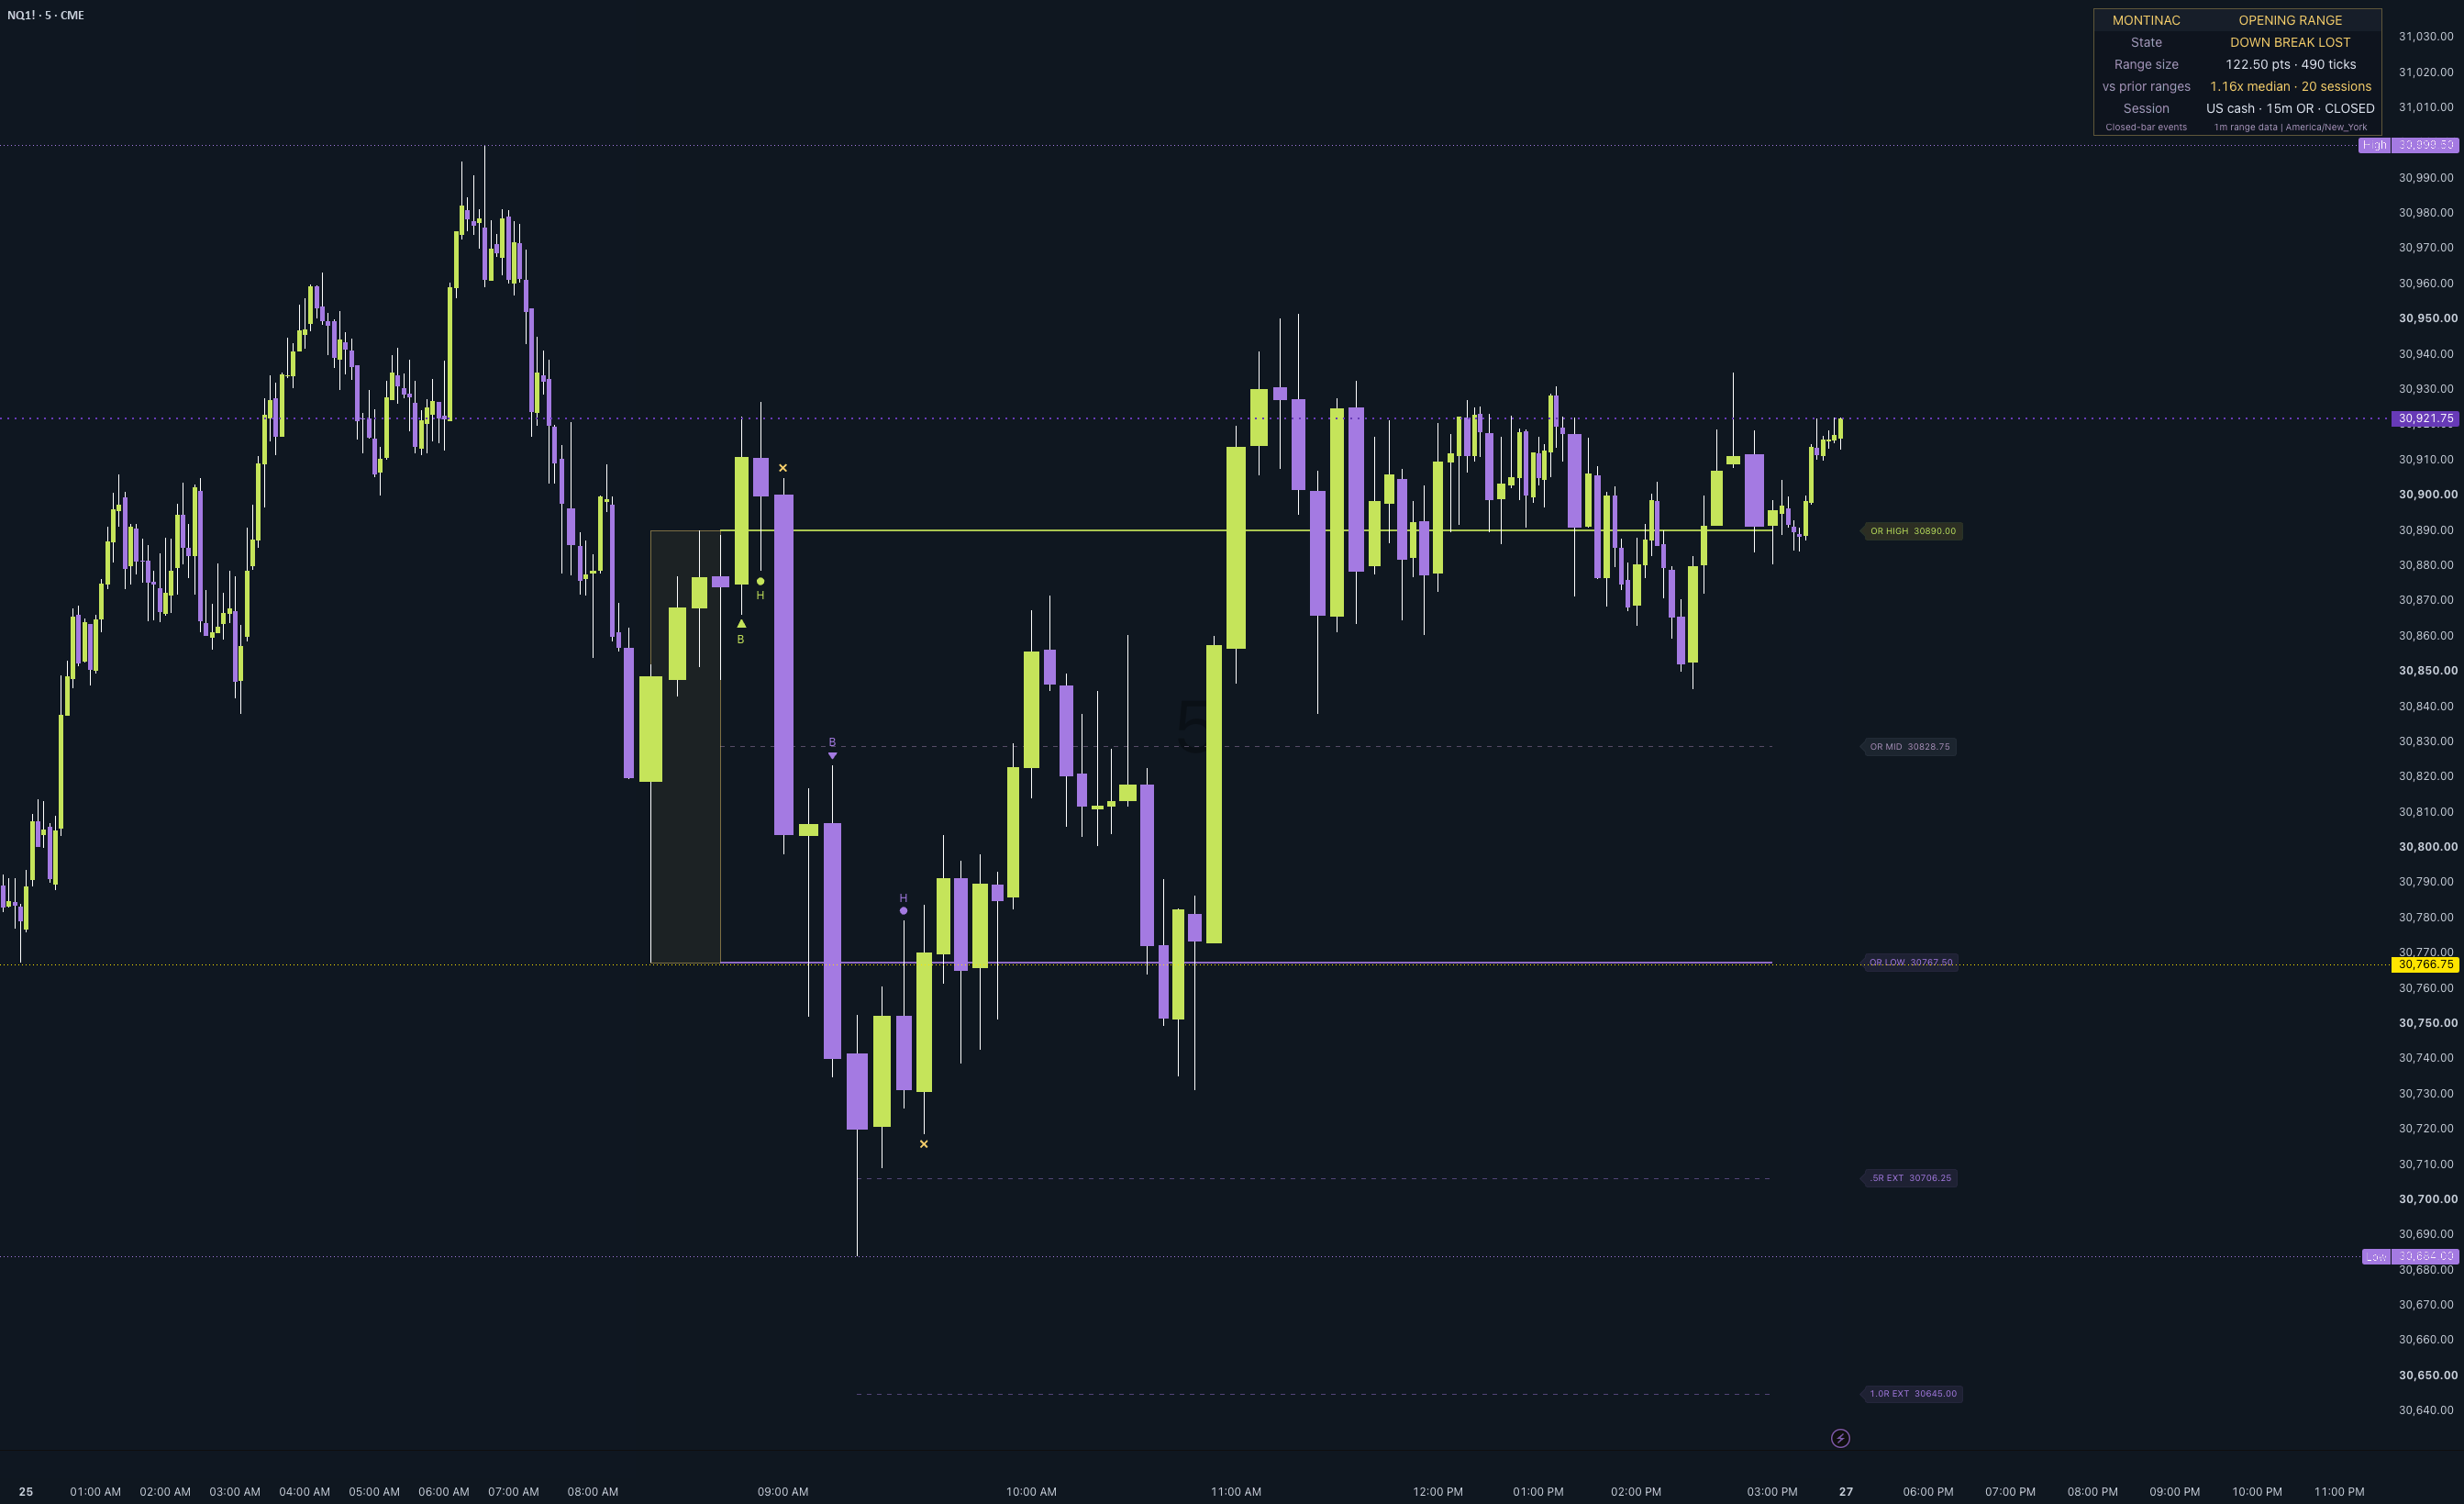
Published Montinac Opening Range chart showing range boundaries and extensionsView chart

Opening Range

Follow the open, step by step.

Watch the opening range form, then follow confirmed breakouts, held retests and lost breakouts with distinct event markers.

  • 5, 15, 30 or 60-minute opening range
  • US stock-market open preset + custom sessions
  • Range extensions and comparison with prior sessions
What to know

Ranges use one-minute data. Events confirm at your chart’s candle close.

05 / Pressure & volumeFREE
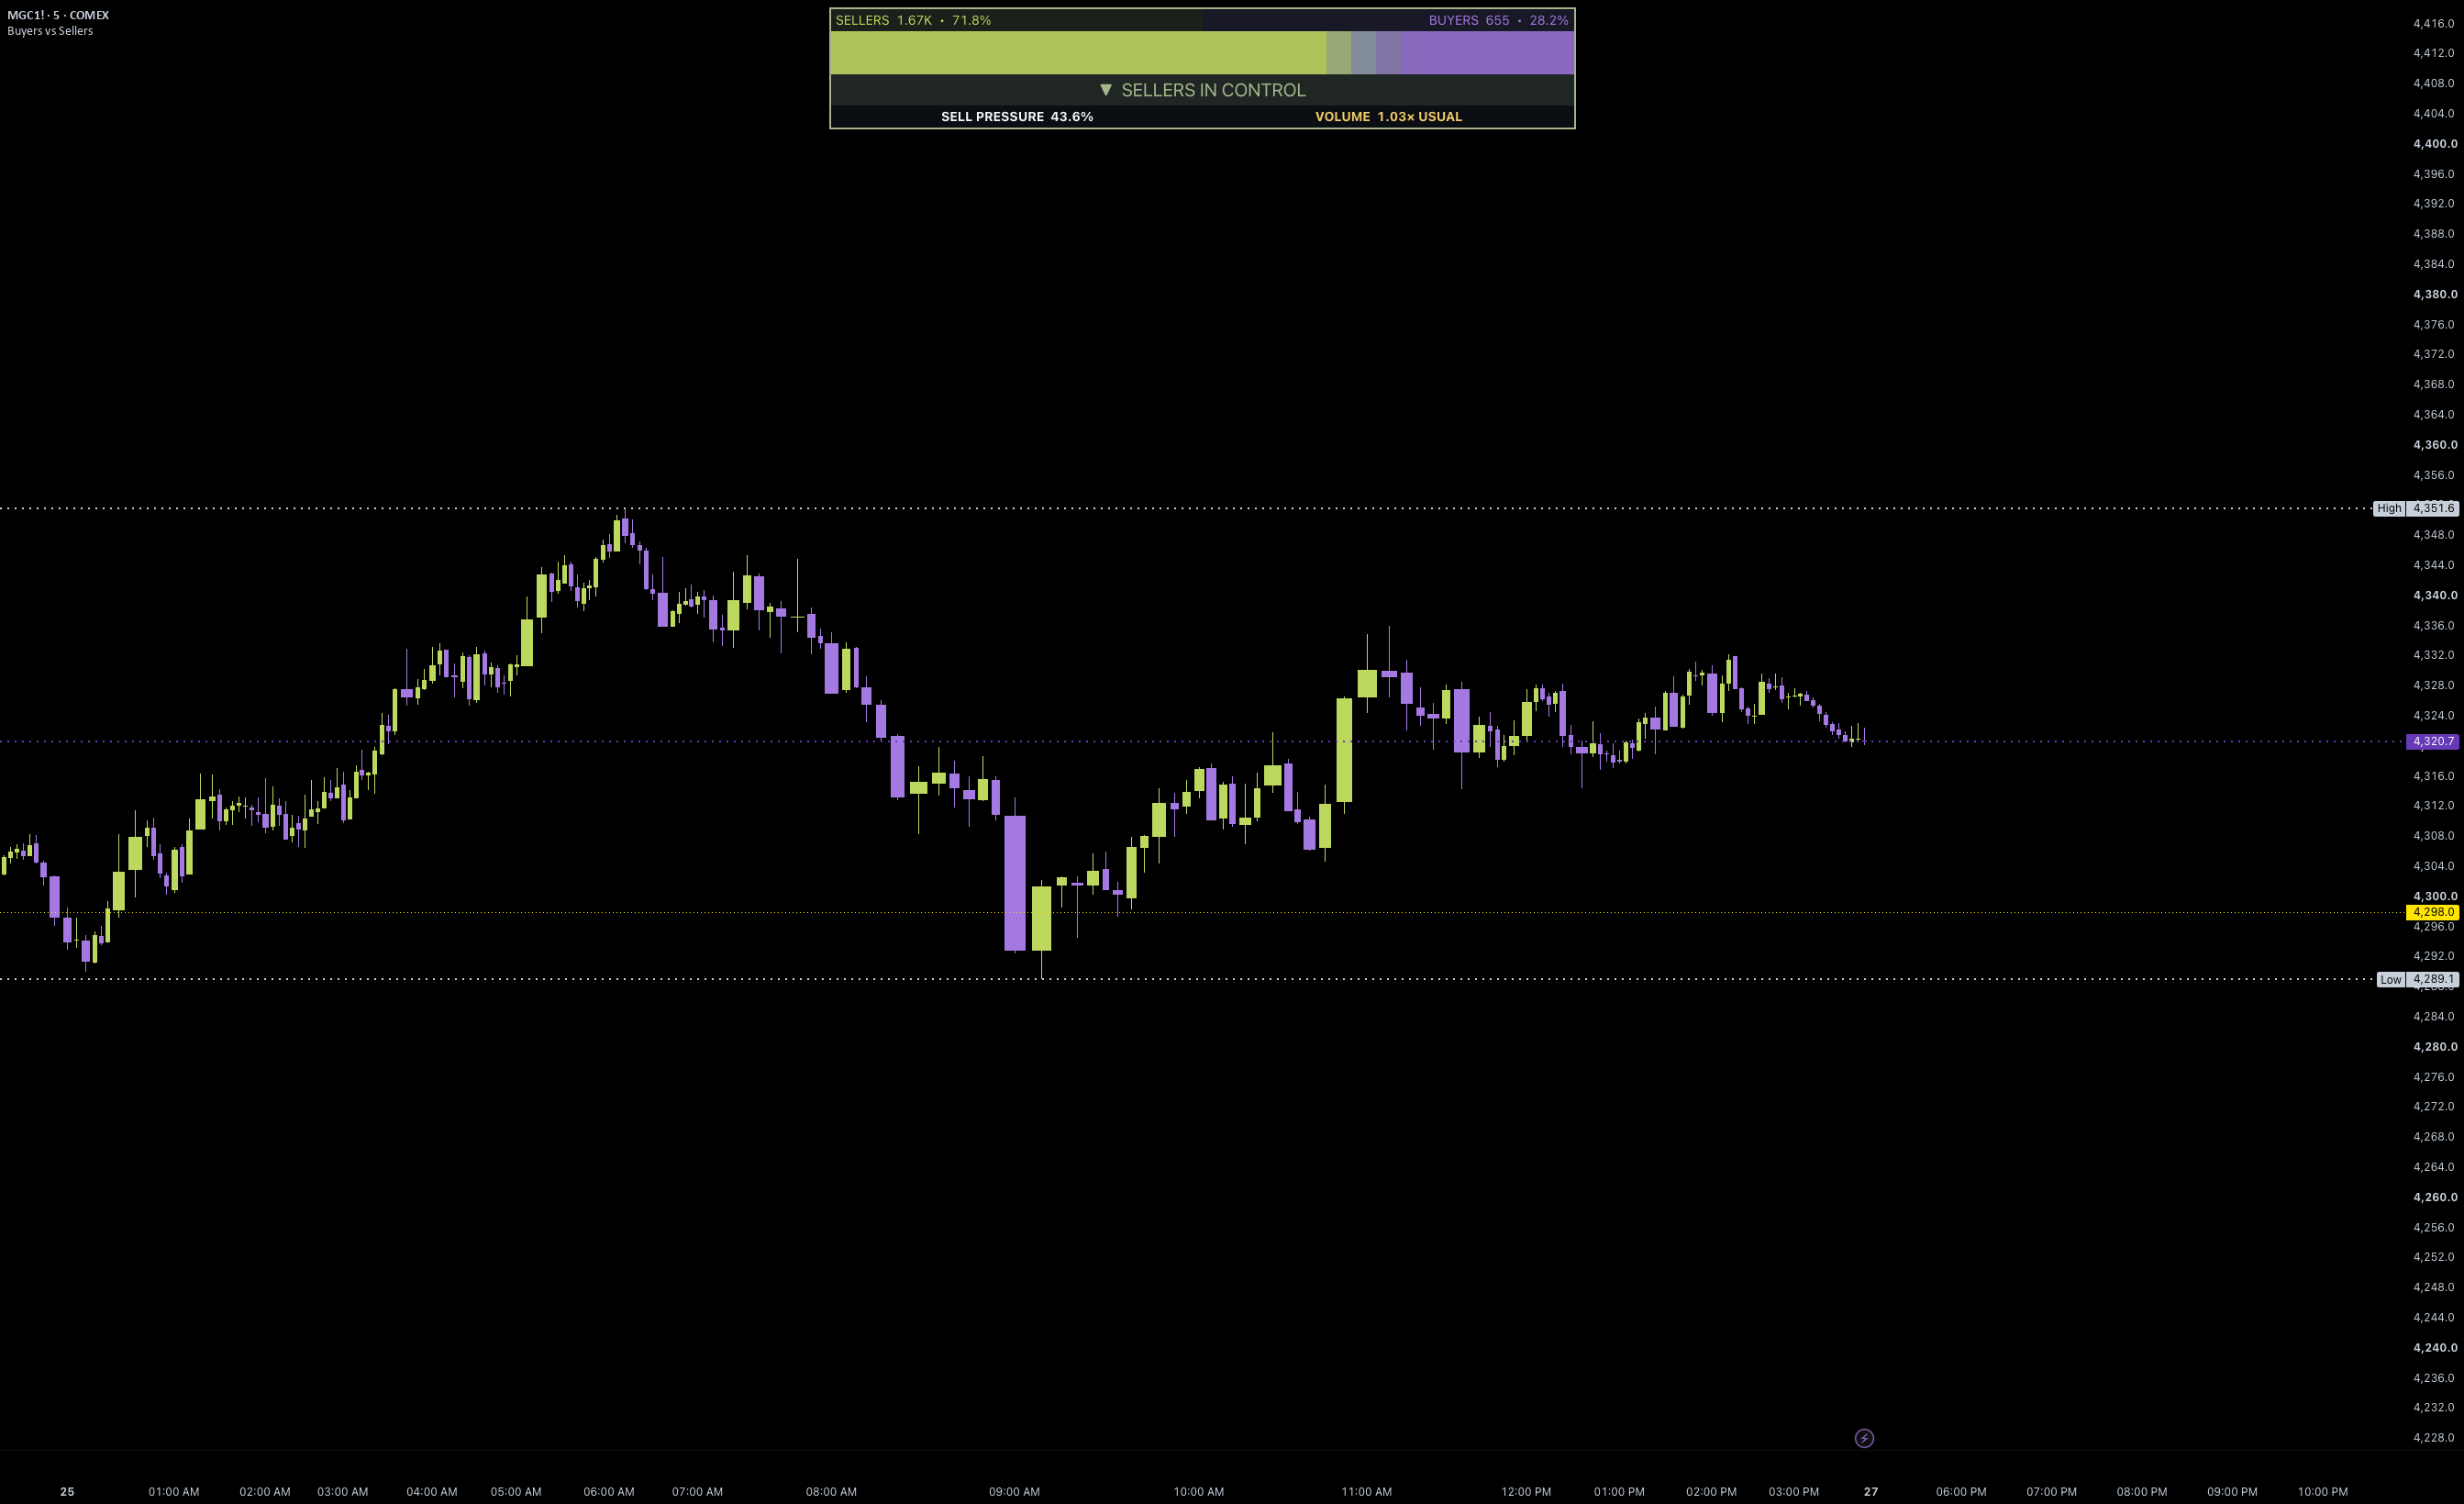
Published Montinac Buyer vs Seller Pressure and Relative Volume dashboard chartView chart

Buyer vs Seller Pressure

Read pressure. Check participation.

A compact buyer/seller gauge pairs estimated directional pressure with relative volume at the same stage of the session.

  • Volume-weighted candle pressure estimate
  • Plain-language buy/sell pressure readout
  • Relative volume against comparable session times
What to know

Pressure is estimated from candle data, not bid/ask order flow. Relative volume uses the latest completed candle.

Chart previews are from the published scripts, styled in Montinac colors. TradingView account, plan and market-data limits apply.

FROM THIS PAGE TO YOUR CHART

Three steps. Then make it yours.

01

Open the script.

Choose “Get free on TradingView” above. Sign in to your TradingView account if needed.

02

Add it to your chart.

Use “Use on chart” on the publication, or save it to favorites and select it from Indicators on your chart.

03

Set your preferences.

Choose your colors, session and display options. The publication explains the calculations and settings.

Explore Montinac on TradingView

MONTINAC TRADING COMMUNITY

Bring your chart.
Join the conversation.

Free tools are a starting point. Join us on Discord for live gold sessions, chart discussion, and help with your setup.

Follow @montinac_capital
Asia Session Gold — Sunday, October 11 at 7 PM Central. Free live session.
THE FIRST SESSION

Asia Session Gold

Sunday, October 11 · 7 PM Central

Free to join. Bring your questions.

WHEN YOU WANT A BROADER VIEW

Meet Summit
and Obsidian.

Explore a complete workspace for market context or structure-based futures pullbacks. Watch the demos and decide what fits your process.

Compare the premium indicators

Chart preview

Published TradingView chart · Open full size ↗

Share this indicator

ACTUAL INTERFACE

Chart detail

Historical interface screenshot with Montinac colors applied, not live data or a performance report. Other indicators may be visible.