
Explore the interface.
Not a sales pitch.
Choose an indicator, then explore four features using actual historical screenshots. No invented performance or simulated live signals.
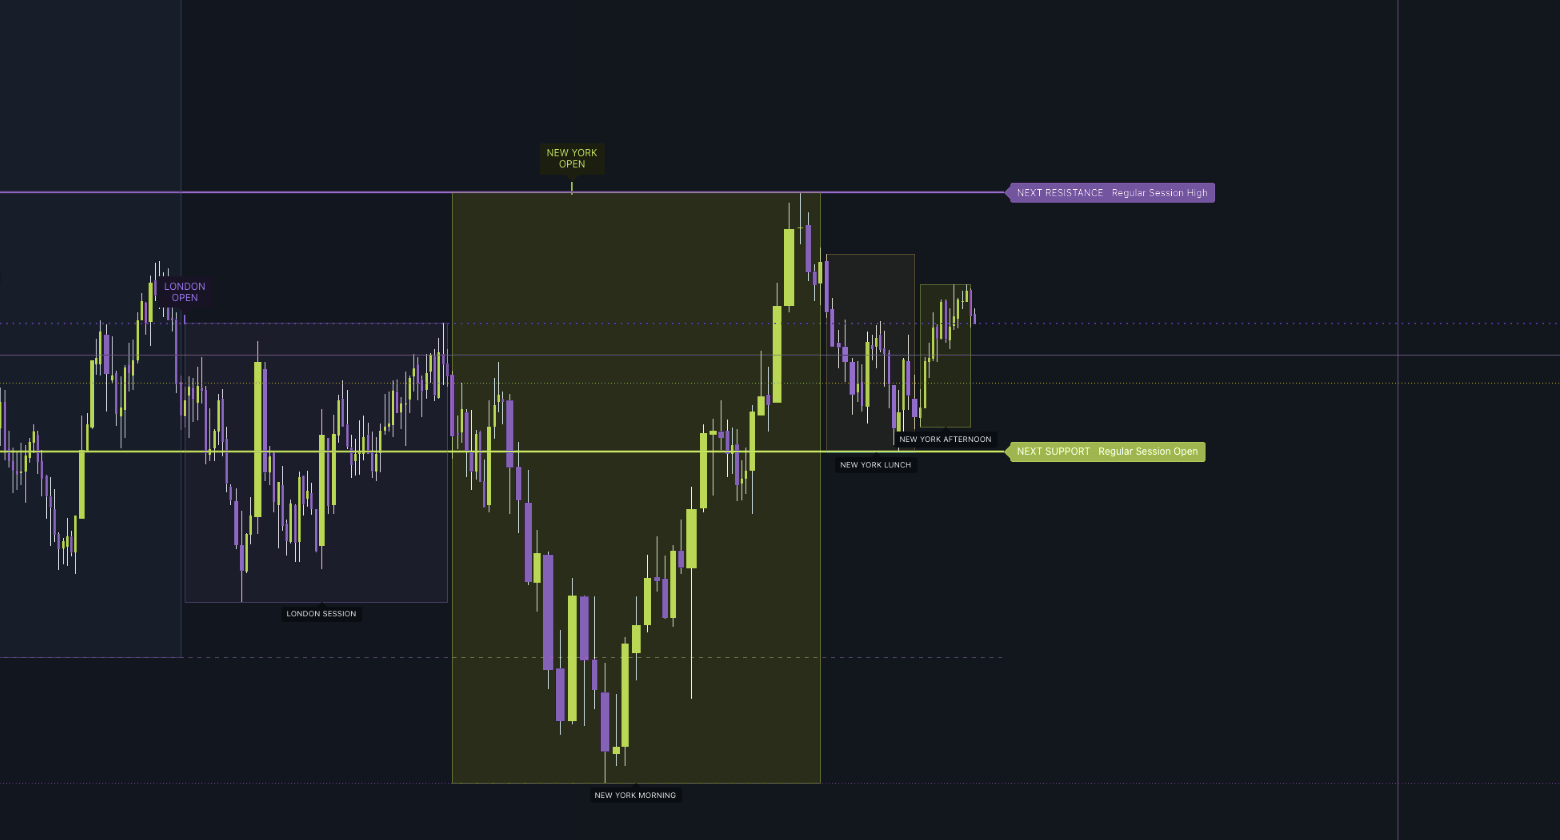
Bring price and context into one view.
Session ranges and mapped support and resistance frame the price action. Explore the next chapters to see how evidence and readiness differ.
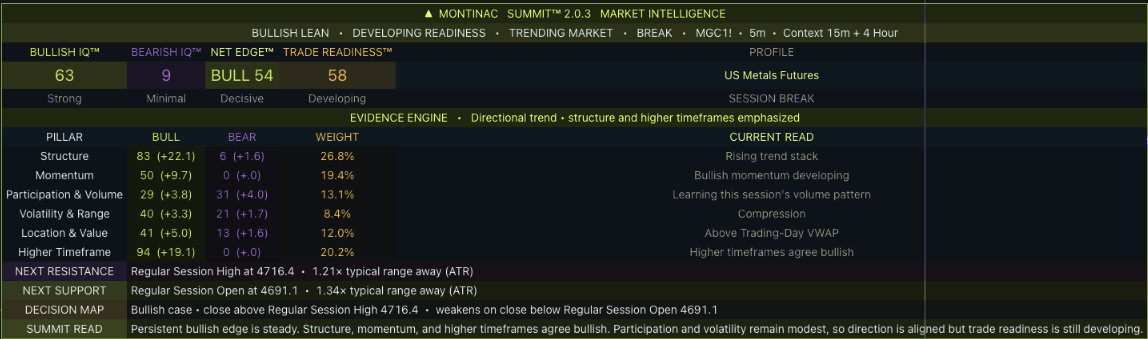
Read both sides of the market.
In this saved view, Bullish IQ is 63 and Bearish IQ is 9. They are independent evidence scores, not percentages that must add up to 100.

Direction is not the same as readiness.
The same snapshot has a bullish edge, but Readiness is only 58: Developing. The environment and nearby levels matter alongside direction.

See what supports the conclusion.
Detailed mode exposes Structure, Momentum, Participation, Volatility, Location and Higher Timeframe. Each pillar contributes to the evidence scores.
Earlier Summit v2.0.3 interface capture. The current update is v2.1; presentation may differ. Montinac colors applied. Guided stills, not a live chart, video or performance record.
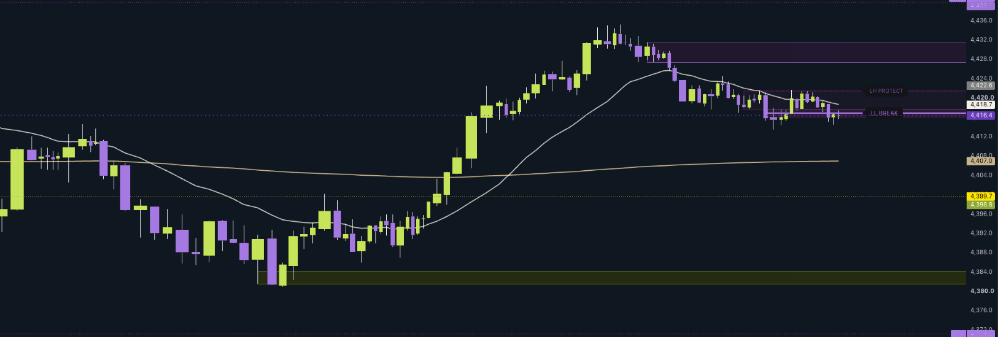
Start with a meaningful location.
Lime demand and amethyst supply frame the recent price action. A zone is a reference to evaluate—not a promise that price will turn.
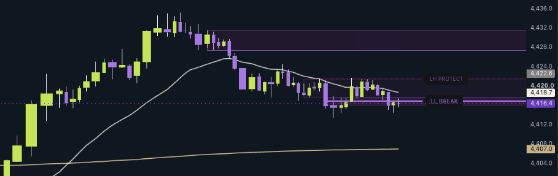
Give the pullback a reference.
The break and protection rails make the current structural references visible. In the released build, a rail retest must occur after its break candle.

Read pressure without pretending it is order flow.
The lime–amethyst bar estimates buying and selling pressure from total candle volume and closing location. Developing readings can change before the close.

Waiting is part of the workspace.
This saved view says LOCKED because its session signal limit was reached. It limits the indicator’s new signals—not your broker orders or account risk.
Earlier Obsidian v7.0 beta capture. The current product is v7.1; some details differ. Montinac colors applied. Guided stills, not a live chart, video or performance record.
The reasoning behind the read.
Direction is not the same as readiness.
Location, structure and modeled plans.
The current tour imagery comes from earlier versions: Summit v2.0.3 and Obsidian v7.0 beta. It illustrates layout and features, not the exact current release, a chronological replay or verified trading performance.
Choose your indicator.
Compare the workflow, scope and access options.